12
Awave
- 2018 - ZHdK - 3 Weeks - Group work
- Data visualization - Coding - Interactive
- Processing
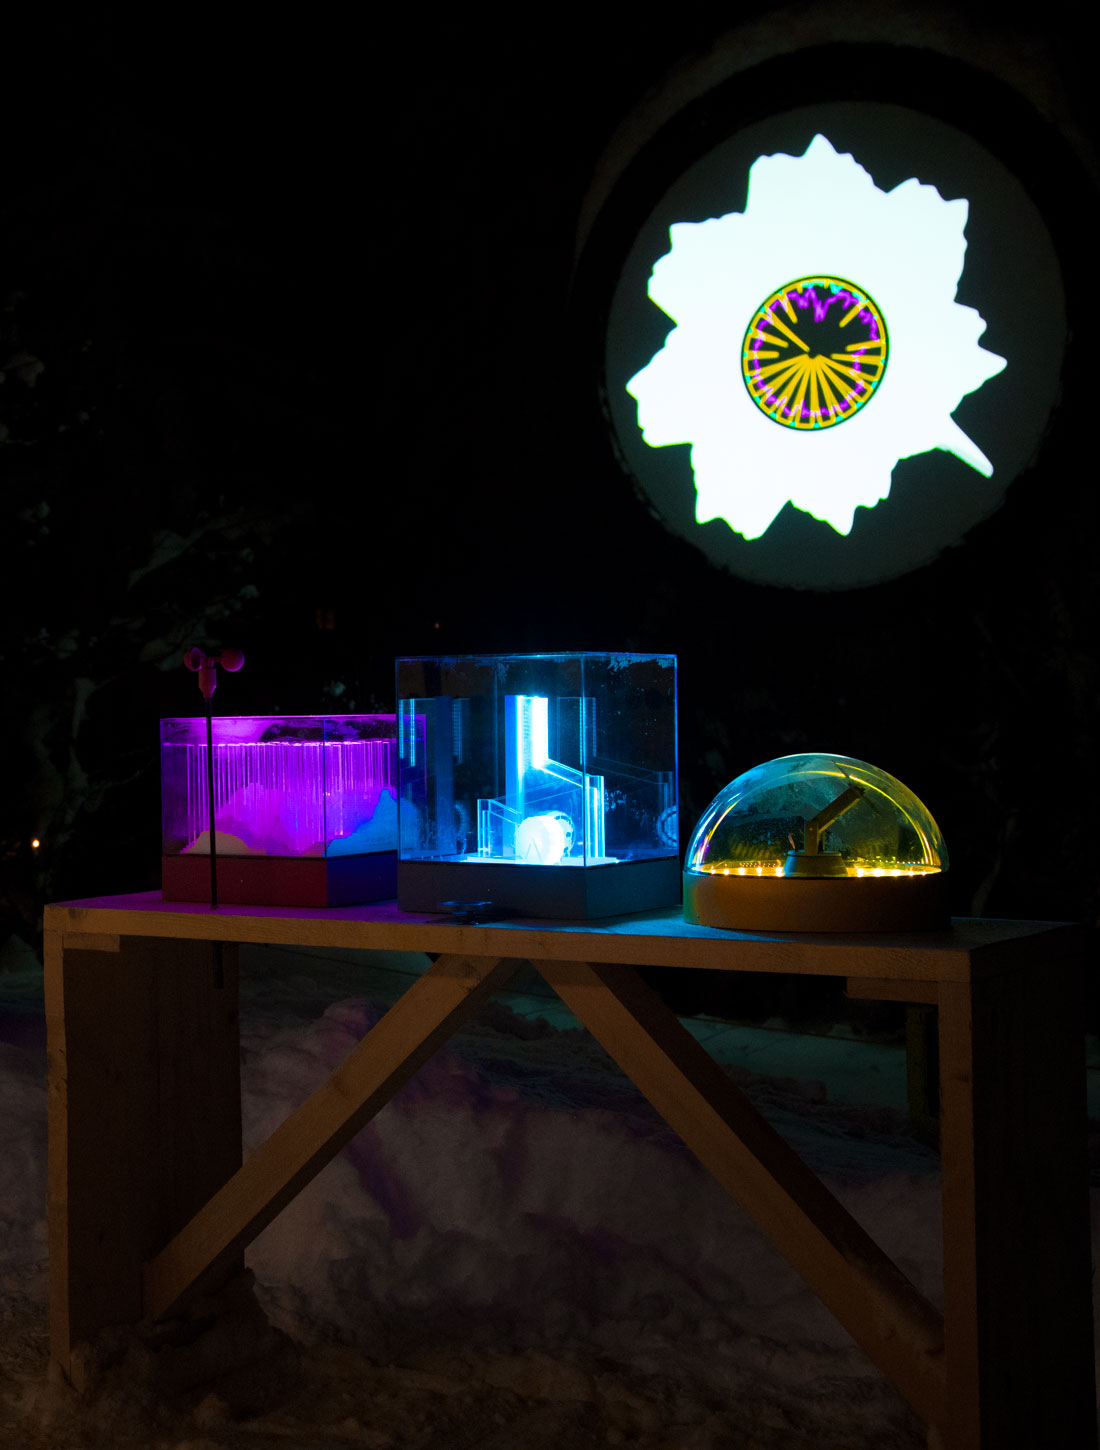
Awave is an Interactive data visualization and was a part of the light installation which was exhibited at the Festival Zauberwald from 14th to 30th December 2018 in Lenzerheide, Switzerland.
The main sponsor was „EWZ Elektrizitätswerk der Stadt Zurich“, one of Zurich’s electricity providers. Therefore, the topic for the whole installation, a collaboration of the entire Interaction Design class, was “sustainable energy sources“ and is composed of 6 input devices and 6 visualizations.


- Visualisation
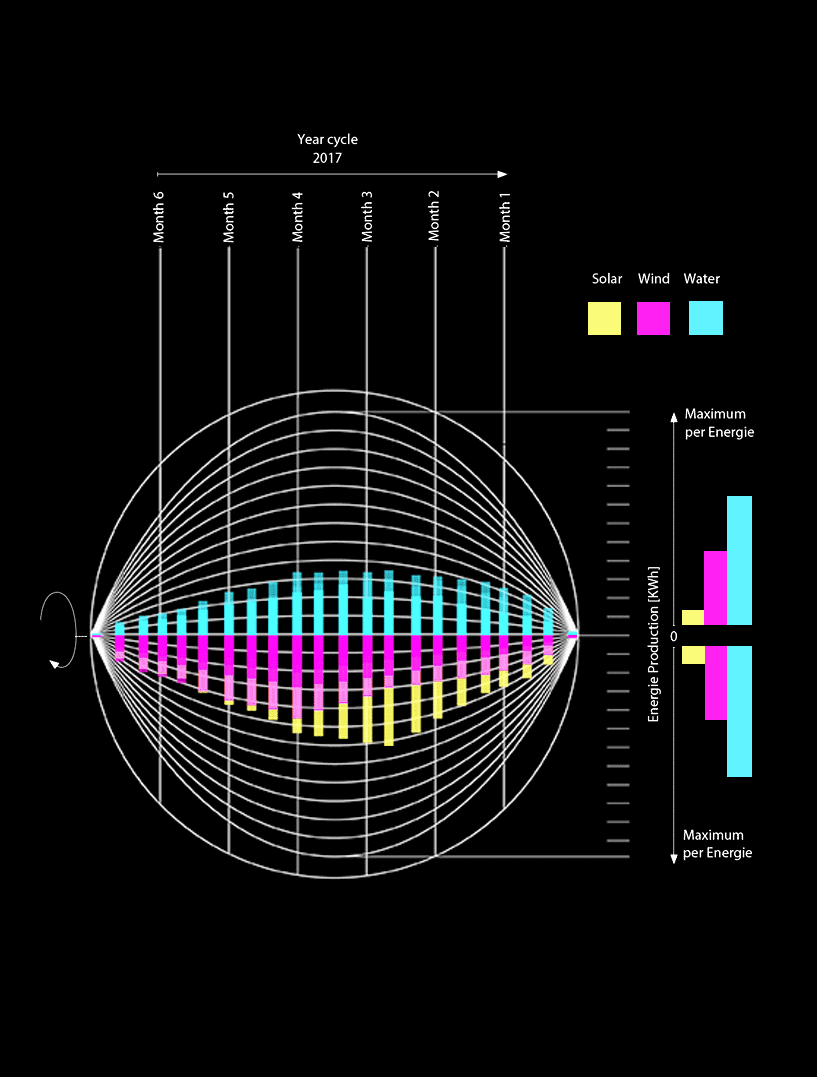
My group composed of Lilian Lopez and Adrin Gorgi worked with the production of the three energies: water, solar and wind. We used the data of the production per month during the years 2017 of each EWZ's plants that produce renewable energy.
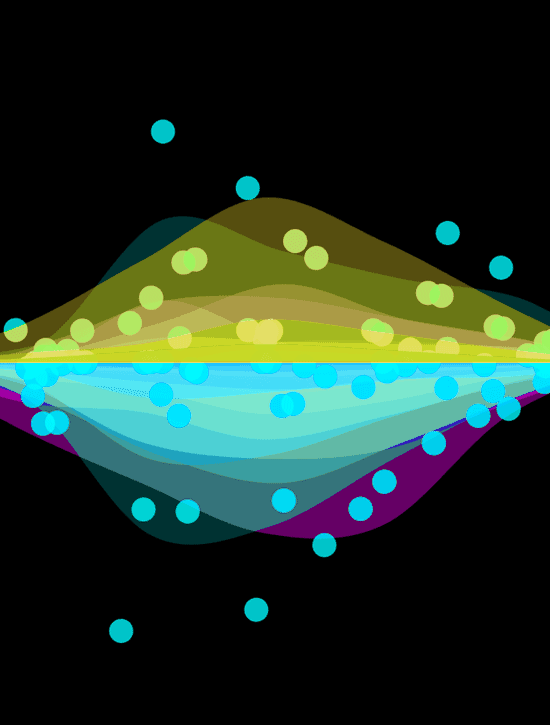
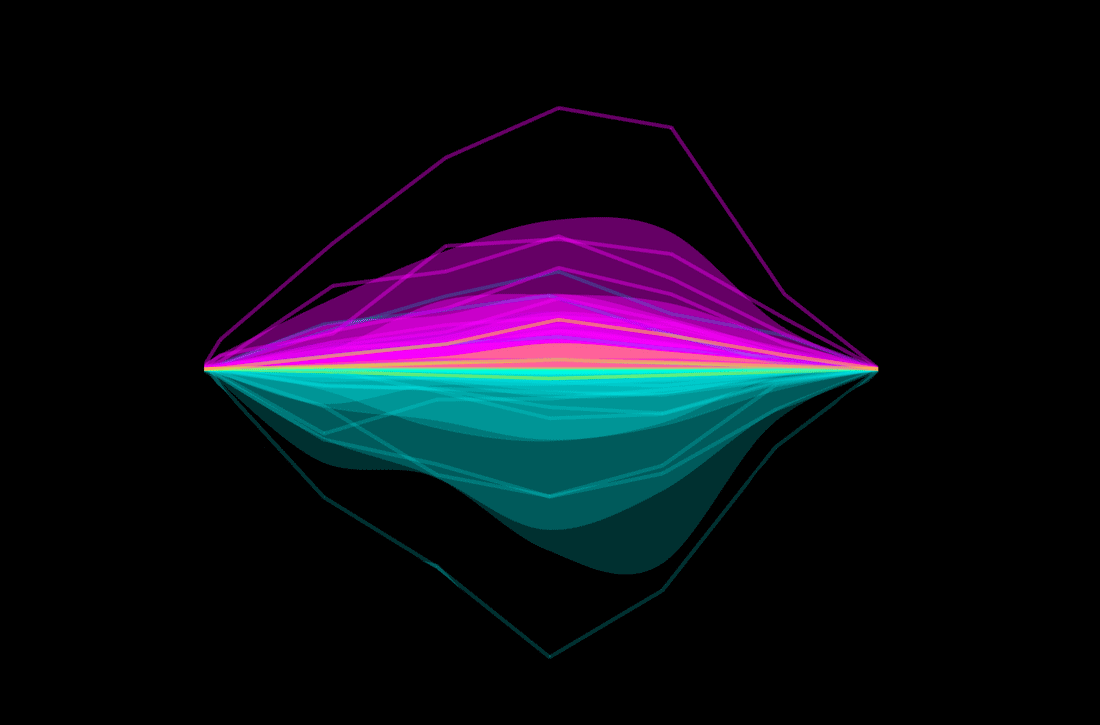
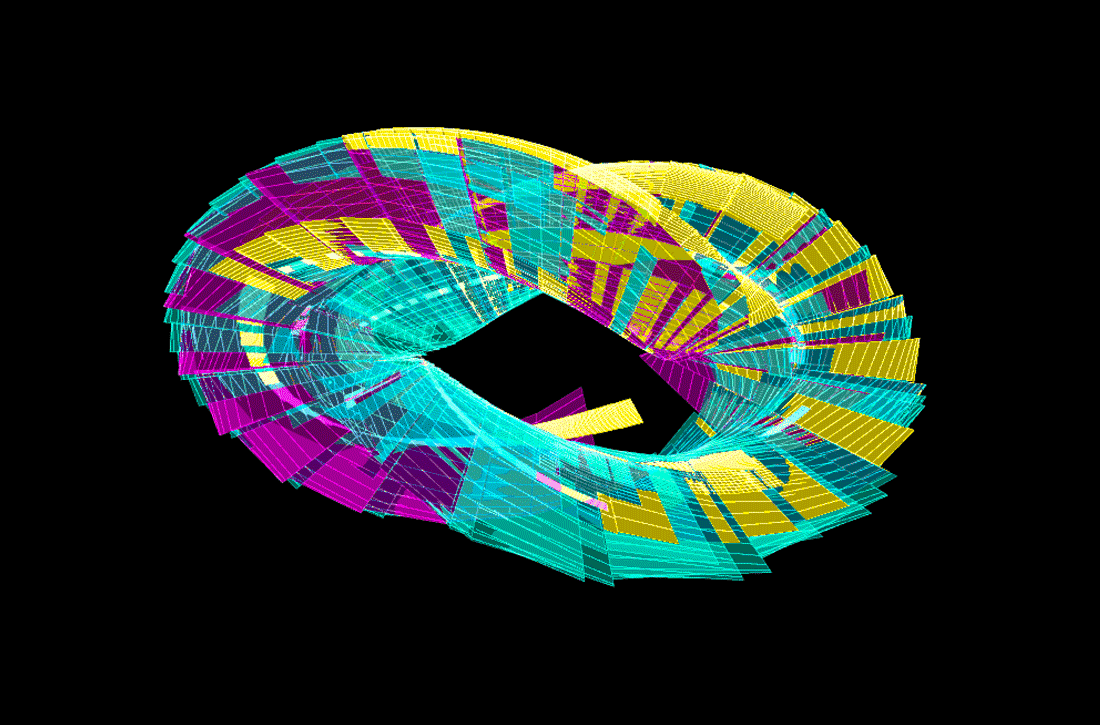
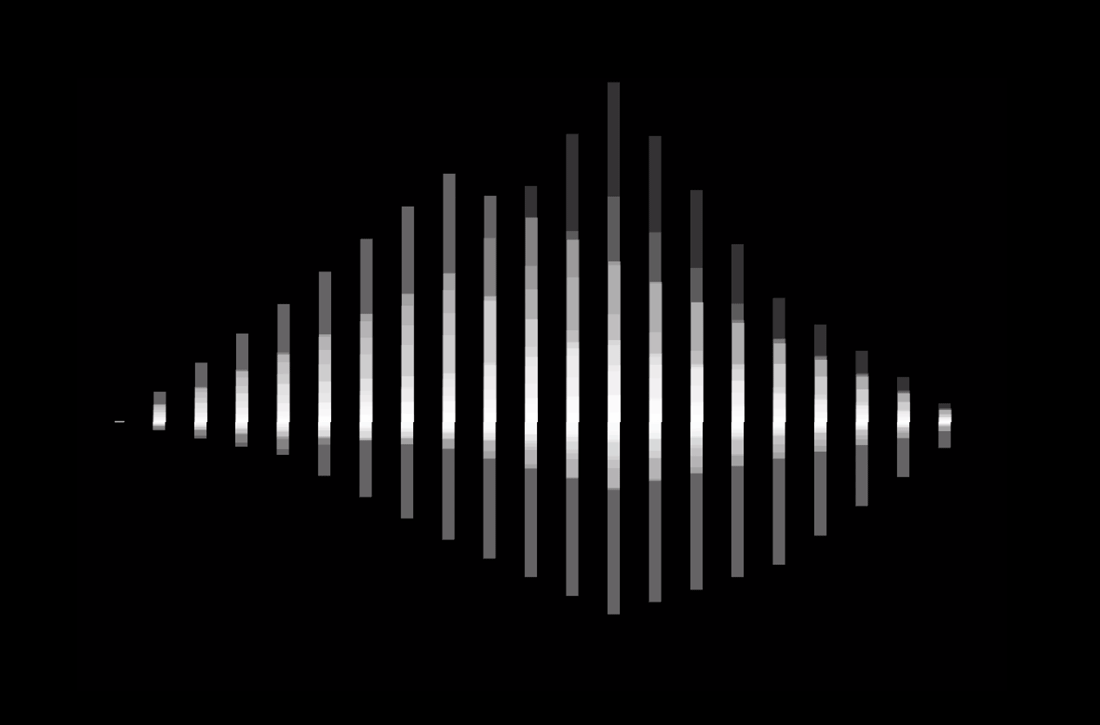
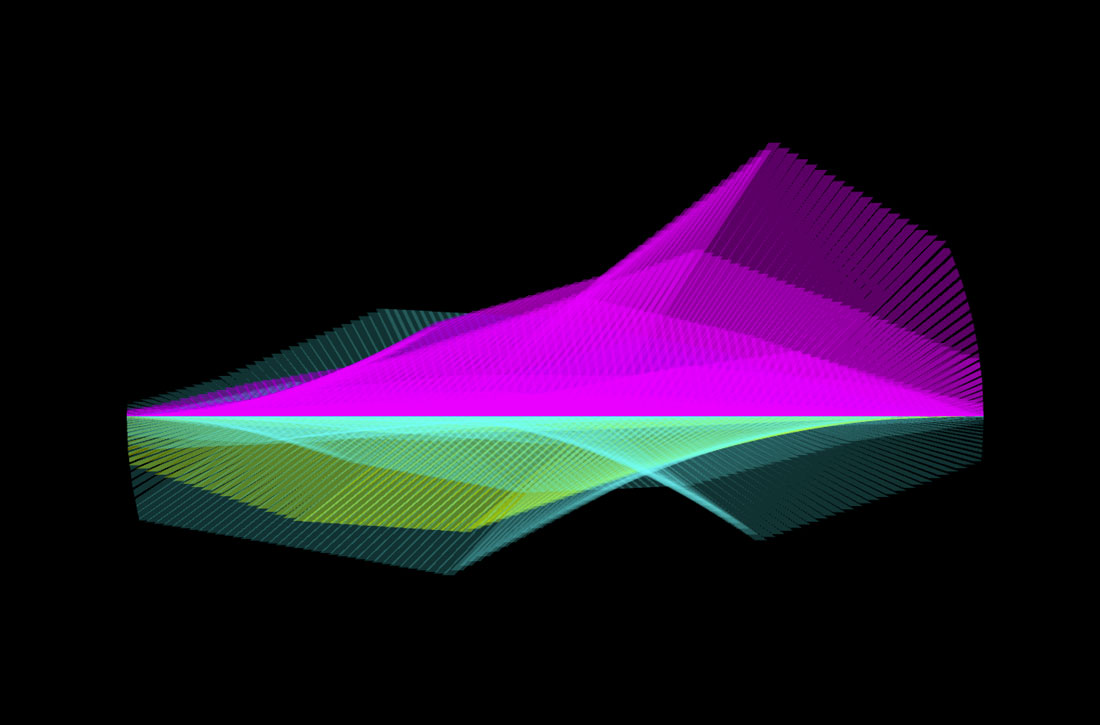
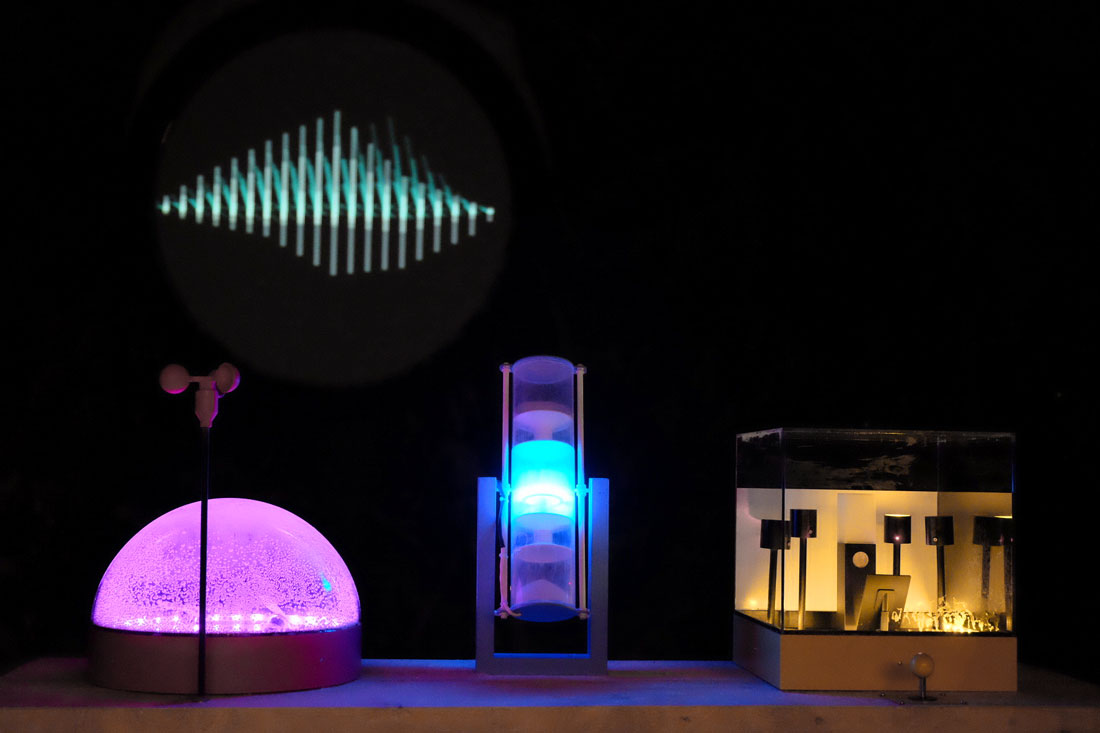
The whole circle represents half a year, like a time line moving from left to right. Each different power plant is represented by a beam surface. The surfaces are a little transparent and are arranged on an axis like flight stabilizers at the rear end of a dart.
We animated it like a dart, which turns around its own axis in flight. Thus, the surfaces also rotate around their axis to create an excitingly moving aesthetic. To fill the circular format provided to us as much as possible, we integrated a loop effect.
- Interaction
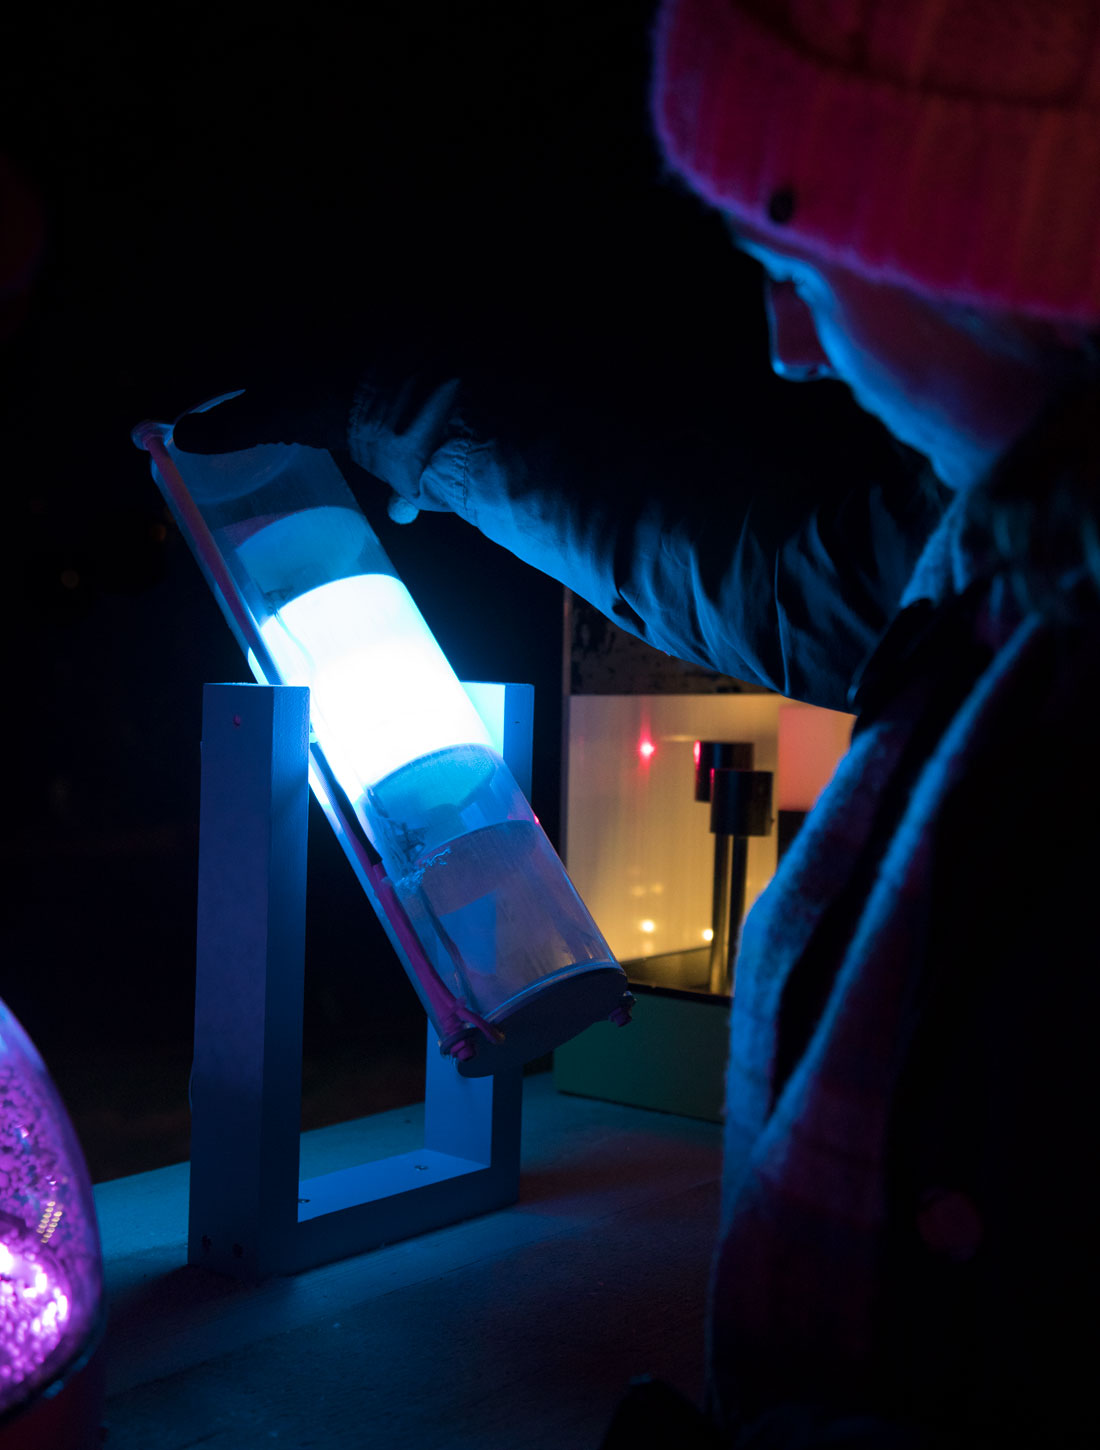
For the installation, it was important to make the visualization interactive. The interaction takes place through the 6 devices created in another course and is divided into the three categories: water, solar and wind. For us, it was important that the input devices do not alter EWZ's data.
We decides that the use of the devices should highlight the three categories. However, the angle of the bars as well as the thickness and amount of bars changes to make the interaction more impressive. When interacting only with solar devices only the yellow bars appears and change, with water devices, the blue ones and with wind devices, the magenta ones.
- Zauberwald
The „Zauberwald“ takes place in Lenzerheide by the end of December and is suppose to bring around 30‘000 tourists to Lenzerheide to experience nice light installations during the Christmas time.
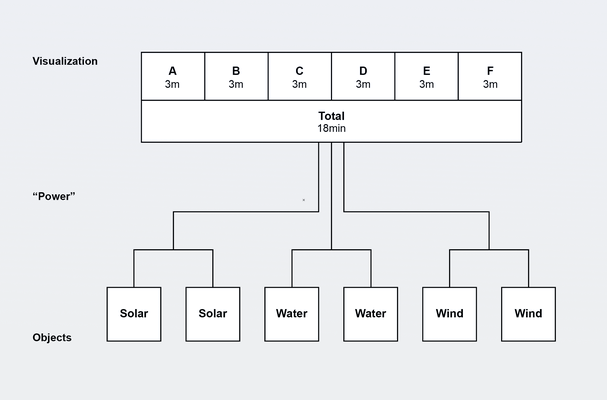
As a class, we had the opportunity to create and expose a project in the 2018 edition. Our installation is composed of 6 input device and 6 visualization. Each input object embodies one of the three energy sources: water, wind and solar, as an abstract, minimal, symbolical interpretation. The visitors have the possibility to generate "power" by interacting with the objects which represent actual way methods of generating that power in a more simplified fashion.
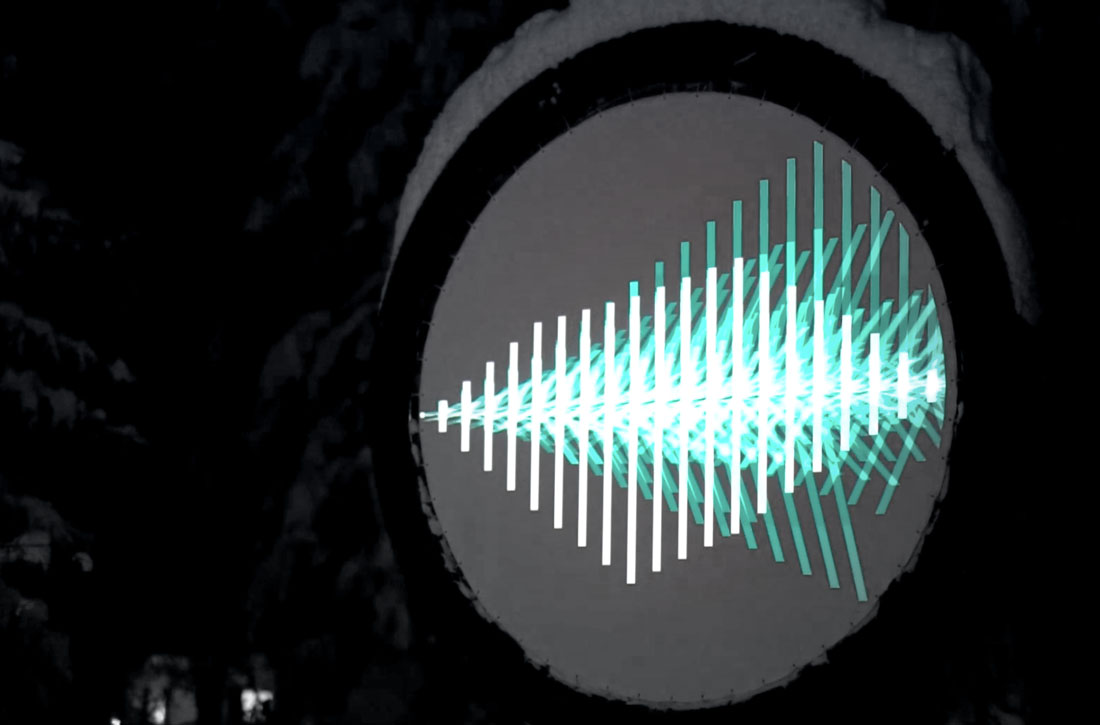
The 6 different visualizations are projected on a big circular screen in the forest. The visualizations harnesses the data emitted by all the objects and are played one after each other.
- Process